Self-Organized Criticality within SandpilesLarsson OmbergIntroductionImagine being able to describe earthquakes, land formations, starquakes, stock market dynamics, evolution and brain signals with one theory. It sounds very far fetched but it seems that these phenomenon have similarities that might lend them to be studied with a unified theory. A dominant common denominator between these phenomenon is that they all exhibit some sort of power law dynamics. For earthquakes the law is known as the Gutenberg-Richter law and has been known for quite a long time. In experimental science the phenomenon is known as "1/f-noise." It was this phenomenon that lead Chao Tang, Kurt Wiesenfeld and Per Bak to formulate the theory of Self-Organized Criticality (SOC) in 1986. A theory proclaiming that these systems evolve into an critical state by them selves a state that gives power laws. Together with their presentation they have developed a very simple model that exhibits SOC Sandpile ModelThe model created can be likened to a pile of sand on which one drops sand grains at a very slow rate. As the grains land they either stay where they landed or role downhill. If they roll downhill they will likely disturb other grains which in turn might disturb other grains. This avalanche of toppling sand grains can be of varying sizes take varrying amount of time. The size of the avalanches just as the sizes of earthquakes follows a power law spectrum. What this means that the number of avalanches N of size s is related by: N(s)=s-t Bak has specified the dynamics of the model to a simple algorithm. A grid represents the sand pile where each position i and j has an amount of sand z(i, j).
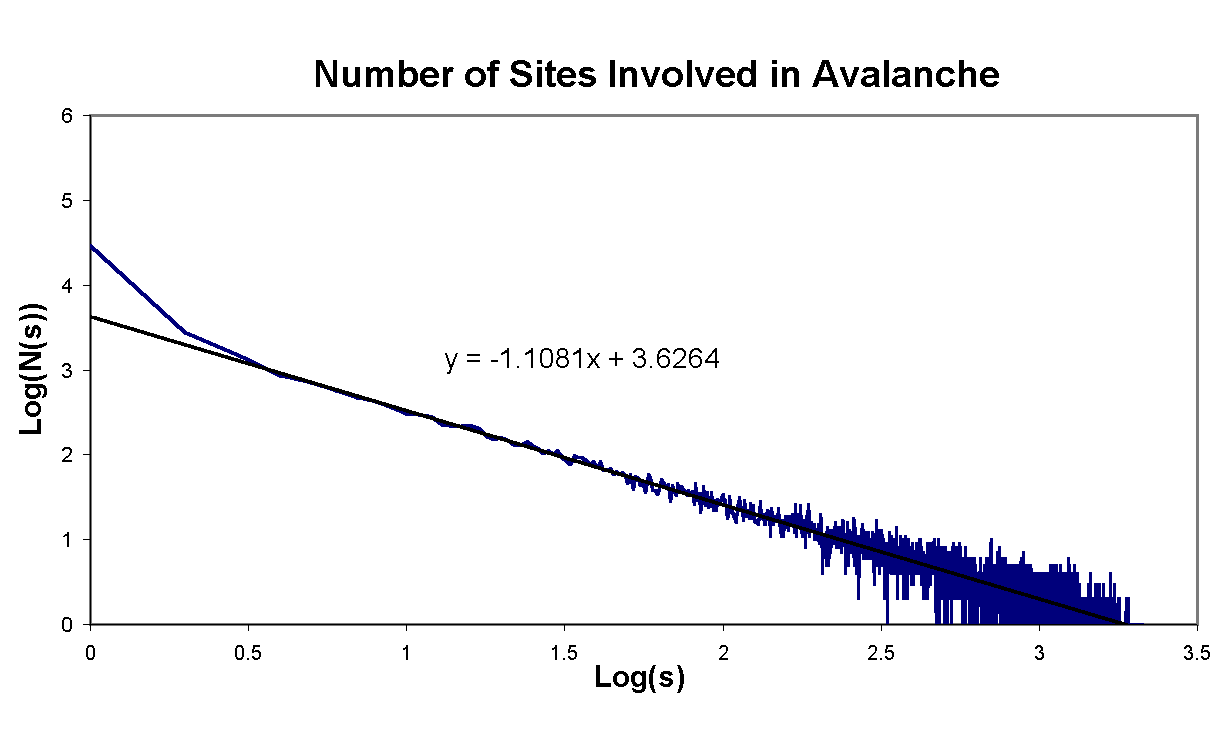
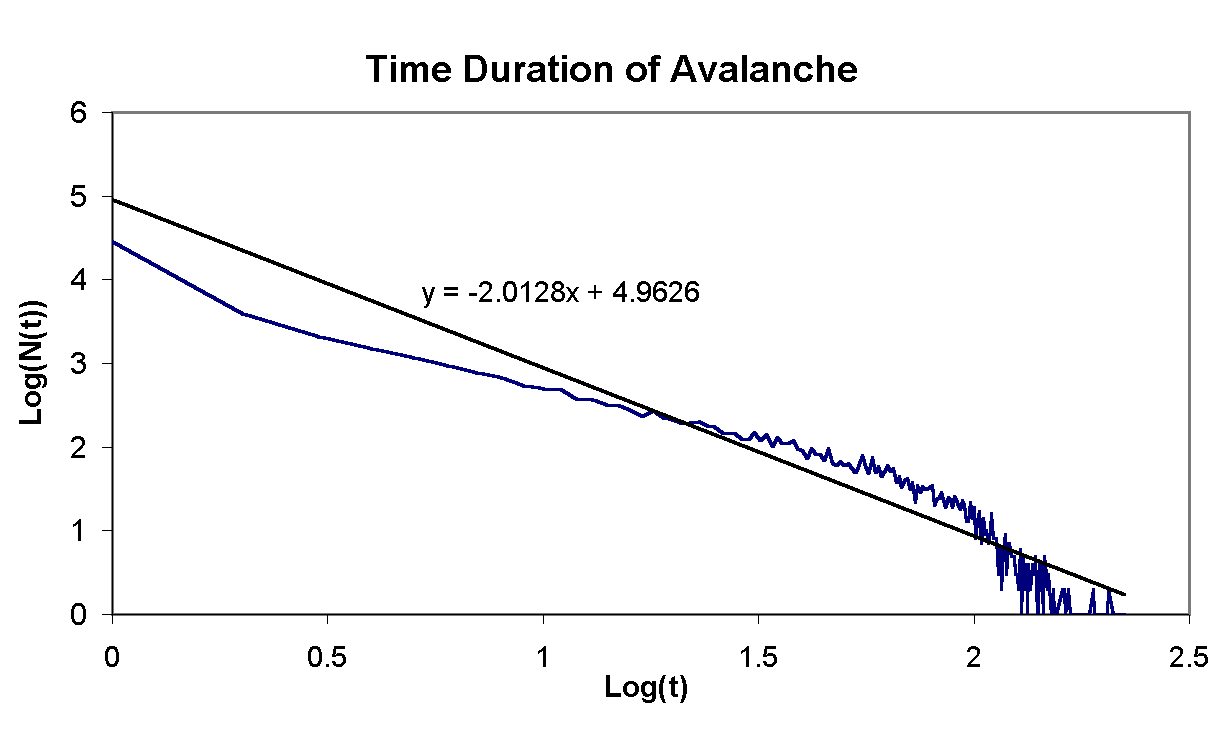
ExperimentThe algorithm was implemented in Java in the form of an applet (see right side). The number of grains at each position is color coded such that darker colors have a lesser value. Before a new grain is dropped the grid is redrawn with red lines surrounding the sites that have been involved in an avalanche. (Please note that the faster your computer the less likely you are to see these red lines.) Whenever the update is halted by pressing the start/stop button the N(s) and N(t) is written to standard out. For the analysis of the dynamics of the pile a grid sized 50x50 was used. The simulation was allowed to run for 50002 dropped sand grains. For each grain dropped the number of sites involved in the avalanche was recorded along with the number of time steps it took for the pile to resettle. AnalysisBy taking the Logarithm of the power law one gets Log(N(s)) = -t Log(s) a linear relation in a logarithmic plot. If the dynamics of the sand pile follows a power law a logarithmic plot of N(s) and N(t) should yield a straight line from which one can obtain t. The plots of the run are displayed bellow. In each plot the black line is a least square fit to the data of which the equation is displayed. From this one can conclude that t for the number sights is 1.1081 and that for the time is 2.012.
ReferencesBak, Per. How Nature Works, the Science of Self-Organized Criticality. New York: Springer-Verlag, 1996. Schroeder, Manfred. Fractals, Chaos, Power Laws, Minutes from an Infinite Paradise. New York: W. H. Freeman and Company, 1991. |

